TXF: A decade of data
From the post-global financial crisis recovery and the run on the euro to the Arab Spring and Brexit, to the Covid-19 pandemic and war in Ukraine, the export finance community has shouldered significant support across key industries and regions to drive tangible economic growth over the past ten years.

The total debt volume for the global export finance market has bounced around the $100 billion mark each year over the past decade - a testament to the robustness of the ECA product. After all, the ECA product offering is countercyclical and weathers times of economic boom or bust. 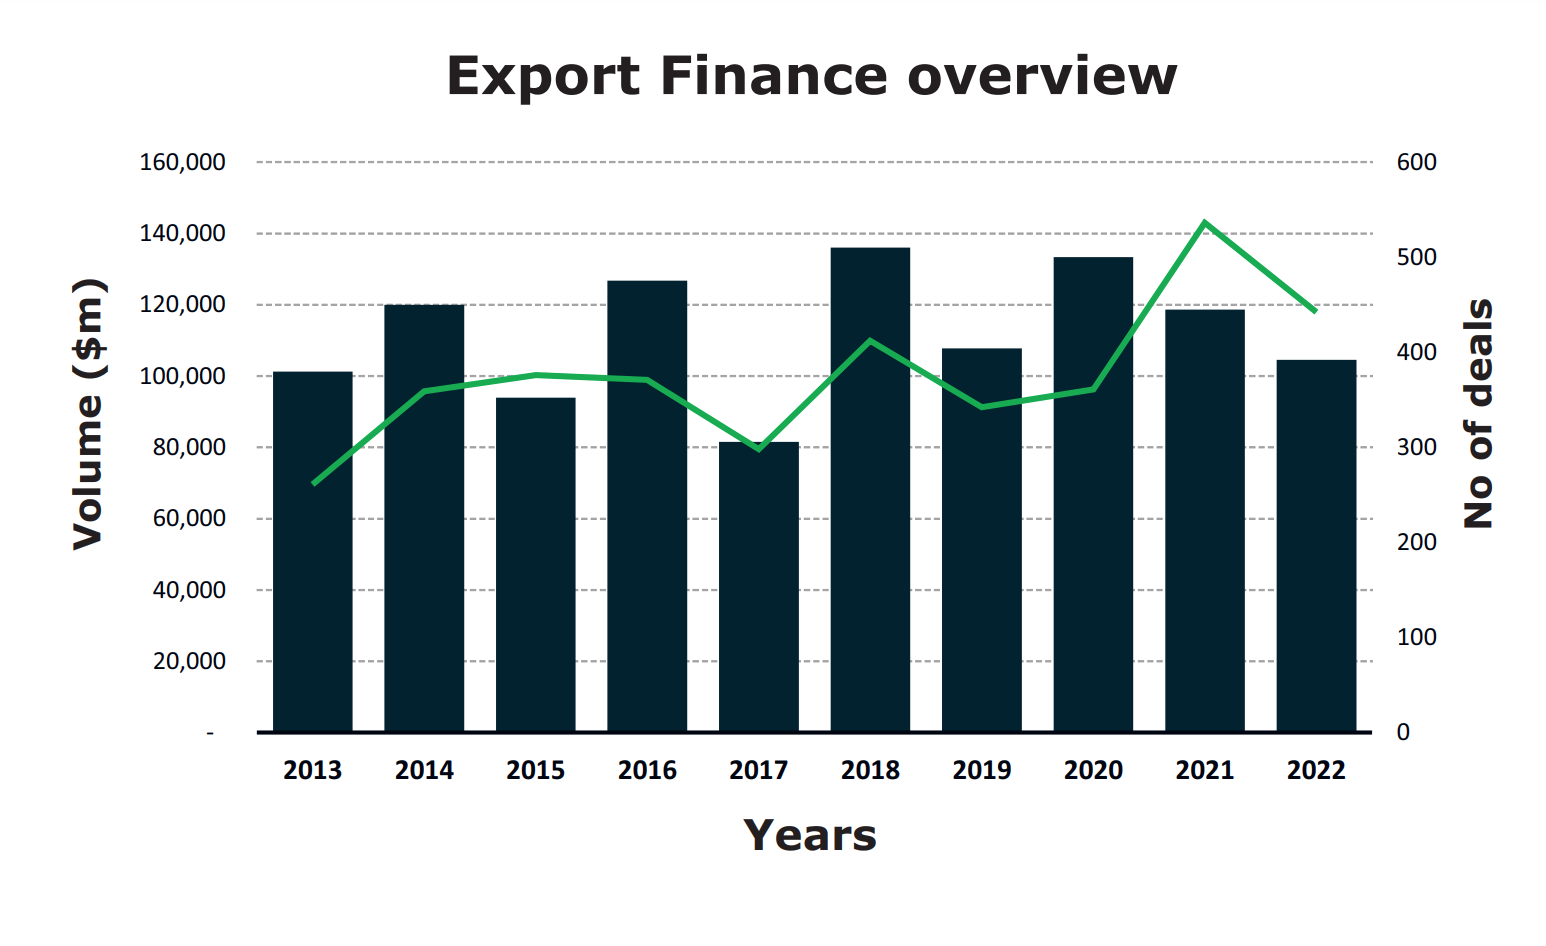
The ECA debt barometer has oscillated over the past ten years though – for example, 2018 was the most active year in export finance since 2013 with a total of $136 billion of ECA debt signed that year across 412 deals; while 2017 marked the most depressed year for deal volume with $81.5 billion across 298 deals.
The pie chart below demonstrates that year-on-year ECA debt volumes remain similar despite the political and economic environment – COVID-19 pandemic included.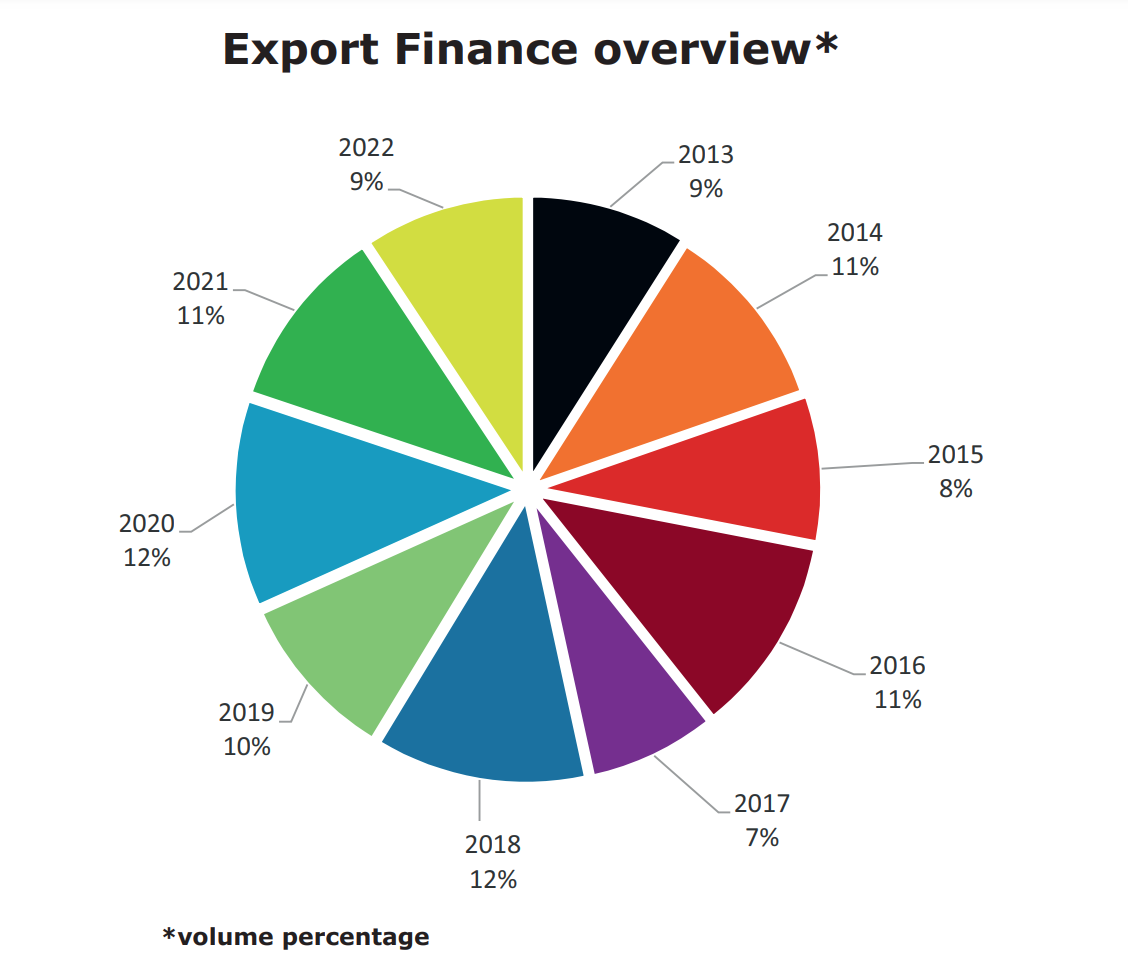
Transition: renewables up, oil & gas wanes
The ECA product evolution has been witnessed by the sectorial shift in support over the past 10 years, with an overall shift towards greener horizons as policymakers, ECAs, buyers, exporters and banks put sustainability at the top of the corporate agenda.
The uptick in deal flow and volume in renewables has been stark especially when pitted against the more recent decrease in year-on-year oil & gas volumes (see graph below) – apart from the closing of the Amur gas processing project in 2019 (€11.4 billion), a year in which oil & gas figures ballooned to record highs of $39.6 billion, and the Amur chemical complex in 2020 ($9.1 billion).
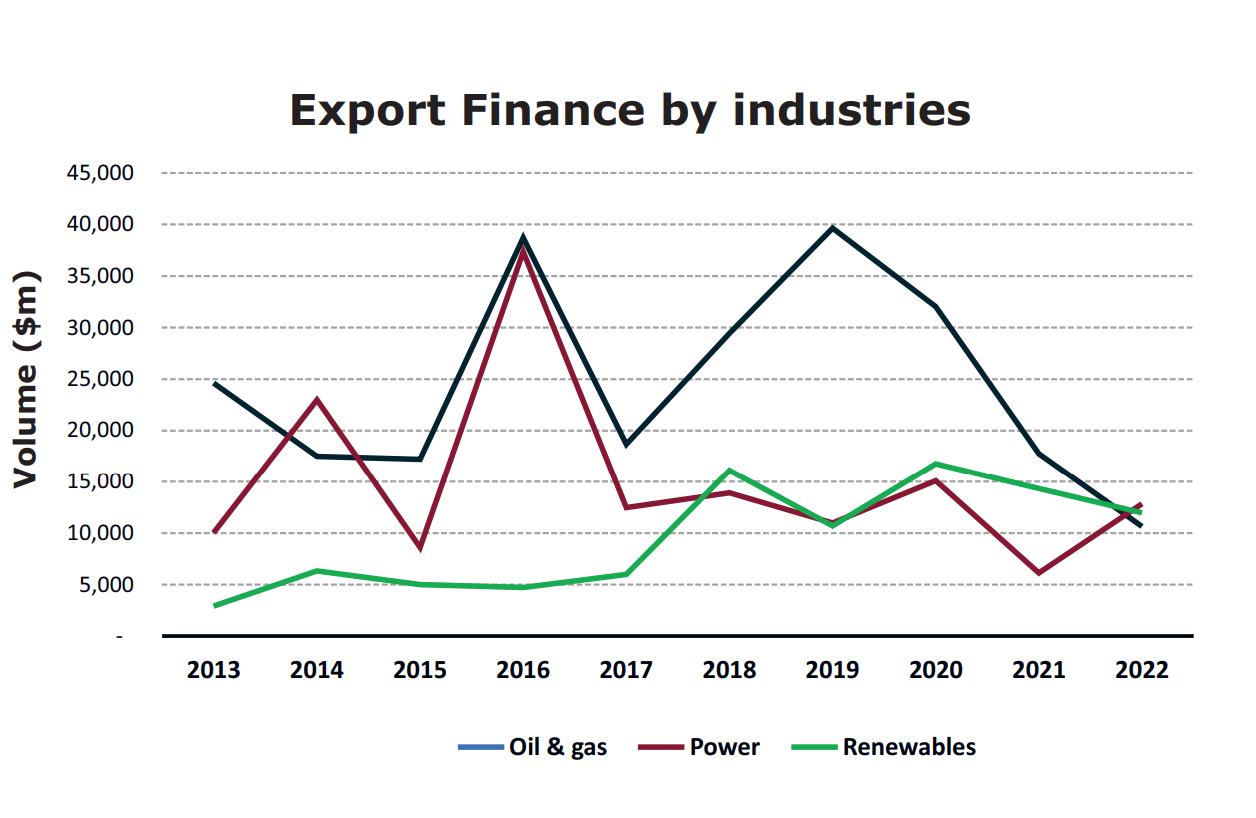
In 2013, ECAs supported carbon-intensive assets to the tune of $24.6 billion, followed by $17 billion in 2014 and 2015. Oil & gas volumes increased with a big-ticket year in 2016 (with a bulging $28 billion of ECA debt in the sector), mostly driven by the $20 billion Yamal LNG project in Russia and again in 2019 due to the previously mentioned Amur deal. But in 2021 those debt volumes decreased to $17 billion and then to new lows of $10 billion given the stronger focus on energy transition from ECAs and banks in the wake of the pandemic and war in Ukraine.
ECA-backed renewable energy volumes totalled merely $2.9 billion in 2013 but ended the decade on $11.9 billion, hitting landmark highs of over $16 billion in 2018 and 2020 respectively. In fact, renewable deal volumes have stayed over the $10 billion-plus mark since 2018, with the mega projects such as Hornsea 1 in the UK and Yunlin in Taiwan garnering heavy ECA support.
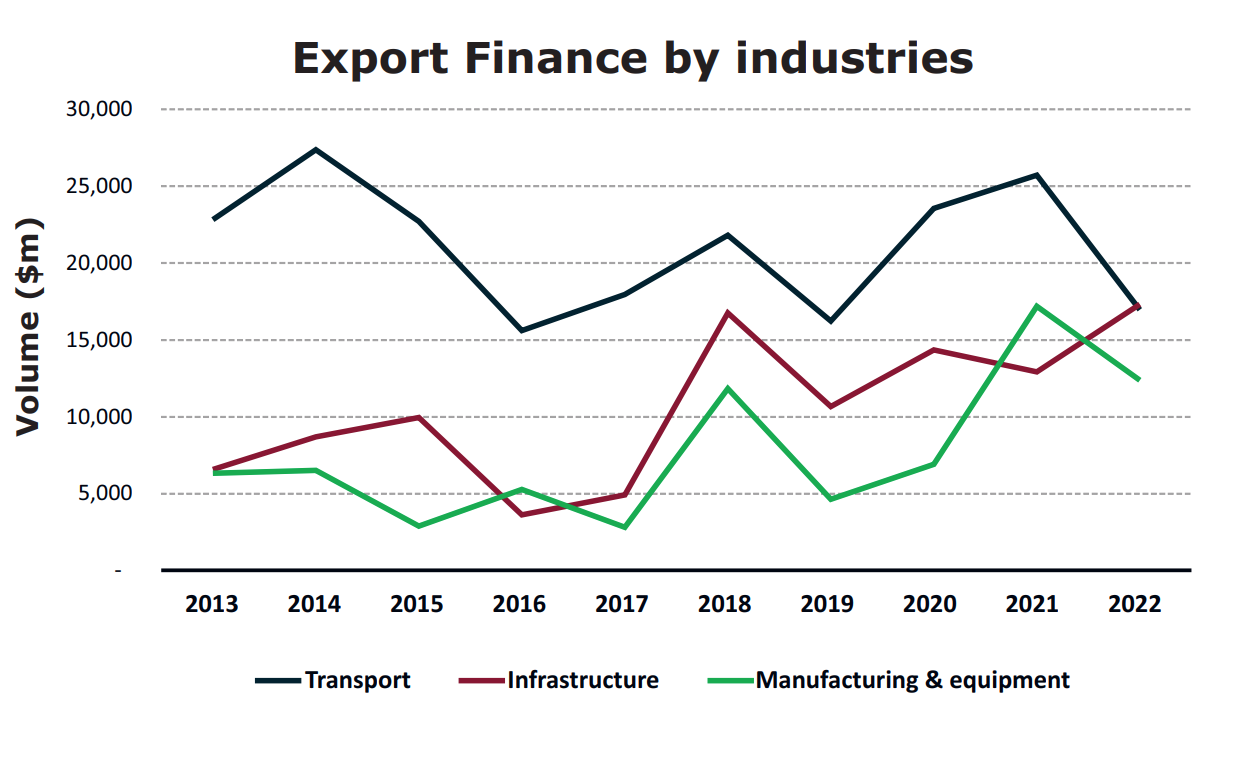
Transport has been the second most active sector for export finance over the past decade with a total deal volume of $210 billion across 890 deals – which marks the greatest deal flow compared to any other ECA sector. The power sector was the third most active ECA sector by volume with a deals totalling $150 billion across 278 deals.
Europe most active region
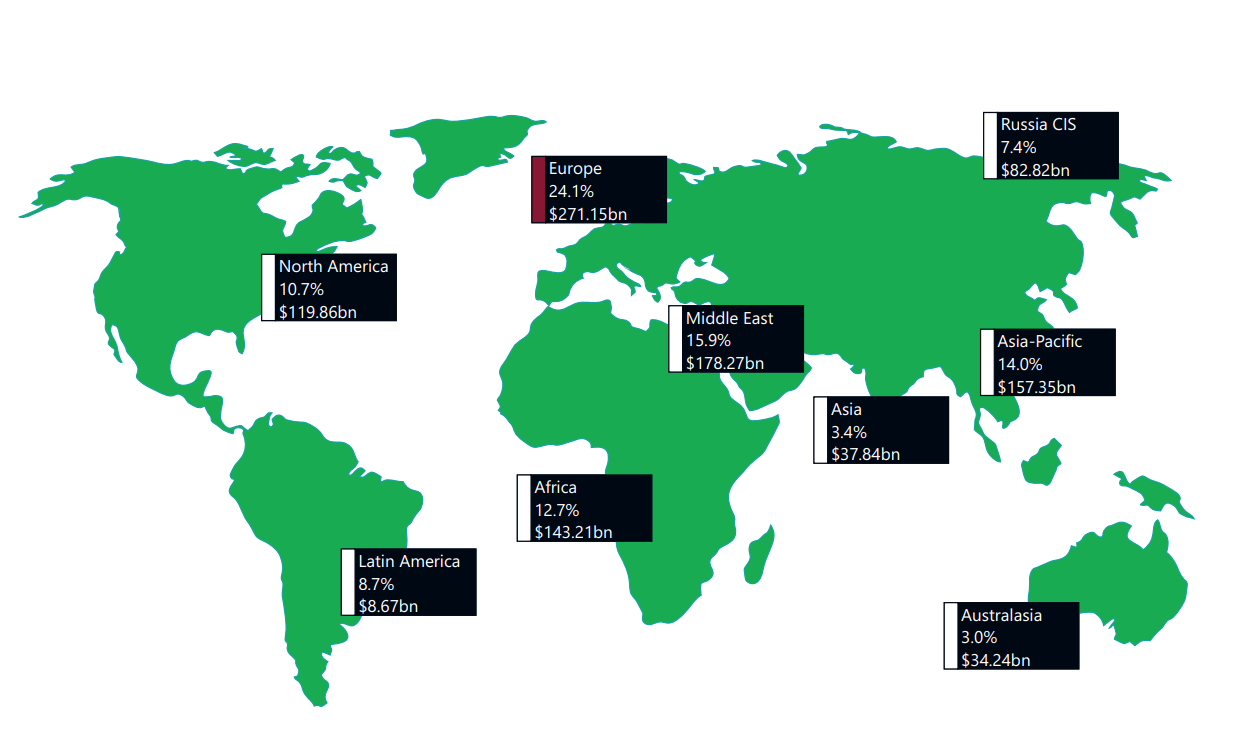
Europe has been a hive of ECA activity since 2013, from large-scale renewable energy projects – for instance, the Hornsea 1 offshore wind scheme in the UK – to big-ticket petrochemical projects in Belgian.
The most active region by ECA debt volume was Europe with a total of $271.1 billion in loans over the past decade. Europe has consistently been a hotspot of ECA activity apart from in 2016 – when Europe was eclipsed by Russia with a total debt volume of $23.5 billion compared to its nominal $11.7 billion – and 2017 when North America totalled $15.7 billion compared to Europe’s ($11.5 billion) and 2019 ($14.4) billion. In more recent years, Europe and North America have tapped more ECA support than emerging market such as LatAm, Asia and Africa.
The Middle East was the second my active region globally over the past decade with a cumulative deal volume of $178 billion across 249 deals; while Asia-Pacific was third with a $157 billion total deal volume across 585. The number of deals reflect that more small ticket deals and pure export contracts were closed in Asia-Pacific compared to the larger bigger ticket project finance deals closed in the ME.
Users of ECA debt
The top user of ECA finance over the past decade was the project vehicle of Yamal LNG in Russia – comprising Novatek, Total and CNPC and Silk Road Fund – with over $20 billion in debt raised over two deals, which comes as no surprise given the total project cost of $27 billion.
The Baraka Nuclear Energy plant topped the chart for highest debt volume for one single deal, totalling $18.5 billion, while the Abu Dhabi National Oil Company sealed $19.9 billion of ECA debt across eight deals.
The Ministry of Angola have closed more deals in the past decade than any other borrower, private or sovereign, with 47 deals, but the deal volume was paltry at $11.25 billion. A landmark deal from the Angolan MoF was the SEK-backed loan for a solar farm signed in 2020
Cruise companies are no stranger to ECA debt either. Royal Caribbean Cruises has closed 30 deals since 2013, with a total deal volume of $17.1 billion; Norwegian Cruise Lines totalled $9.4 billion across 15 deals; and MSC Cruises with $7.3 billion across 17 deals.
And finally, telecommunications companies have increasingly tapped ECAs in recent years with the US’ Verizon signing a handful of multibillion-dollar deals, having raised $9.5 billion of ECA debt across 8 deals over the past decade, as well as a handful of deal with AT&T.


